Home Energy Trends Report 2024


Ryan Gill - Engineer

How are UK households managing their energy bills and consumption in 2024?
Like many parts of the world, the UK is caught in a cost of living crisis, with households tightening their belts wherever possible to make ends meet. One of the household expenses most impacted by recent inflation is the cost of utilities, with bills soaring up and down the country.
With the government, and homeowners, continuing to look at the most energy efficient solutions and products to combat these price increases, BOXT has produced this report to explore the home energy topics that are currently trending in the UK.
The report covers:
- Public interest in different types of energy efficiency solutions
- The regions installing the most heat pumps, solar panels, and EV chargers
- The most popular energy saving solution in each UK city
- The government energy schemes people are most interested in
Key findings
Heat pumps are the UK's leading home energy trend
Public interest in heat pumps has soared over the past year with internet searches rising by 160% in 2023 compared to the previous year.
Heat pump technology is improving rapidly making them increasingly suitable and affordable for domestic use. The launch of the Boiler Upgrade Scheme in England and Wales, which provides grants to encourage property owners to replace existing fossil fuel heating with more efficient, low carbon heating systems including heat pumps, has been the driving force in increasing their popularity with 36,799 installed in 2023 compared to 29,490 in 2022 - a 24.8% increase.
Scotland is leading the way in heat pump and solar panel installations
Six of the top ten locations for heat pump installations are in Scotland with four of the top ten locations for solar panel installations also being in Scotland.
With the Scottish government offering up to £15,000 in funding for heat pump installations, through a combination of a grant and an interest-free loan, and a greater number of homes in Scotland not connected to the mains gas grid, it is clear that heat pumps are a much more appealing offer, and cost-effective option for Scottish homeowners compared to those living elsewhere in the UK.
Scotland is also leading the way with solar panel installations with, on average, over 5% of homes in Scottish local authorities having installed photovoltaic solar panels over the last ten years. As with heat pumps, the Scottish government offers both a grant and loan to homeowners installing solar panels and solar batteries which once again demonstrates how the removal of financial barriers can significantly improve the take up of renewable energy solutions.
Public demand for government assistance with energy bills is huge, with more than 3.6 million annual searches for energy schemes.
Soaring home energy costs have led to the government introducing a number of schemes designed to help the most vulnerable households and those with outdated heating systems. The Cold Weather Payment, which is available to certain households if the average temperature in their area falls to zero degrees Celsius or below over seven consecutive days, is the most popular government scheme in the UK with almost 1.17 million searches in 2023.
What does this research tell us about the future of sustainability?
Andy Kerr, CEO & founder of BOXT the leading online installation platform for home efficiency solutions, comments:
“The desire for a sustainable and energy-efficient future for UK home heating is undeniably growing.
“From this report, it is clear that to improve installation numbers of sustainable energy solutions, more needs to be done to make them more affordable. The Scottish government’s grant and loan scheme, which also includes hybrid heat pumps, has been hugely successful in driving up heat pump and solar installations.
“We need our government to show a similar level of commitment in order for consumers to consider making the switch. Unfortunately, the delay to the start date of the Clean Heat Market Mechanism policy has only continued to unsettle the industry and cause confusion for consumers.
“It is highly likely that gas boilers will remain in many UK households in the coming years, whilst the heat pump technology continues to develop and consumers start to understand more about the most efficient use of heat pumps in their homes.
“Homeowners need clear guidance about how home efficiency improvements can be made, including insulation requirements and radiator guidelines, which are vital for optimum heat pump performance - but can increase upfront installation costs.
“A recent update to requirements for the Boiler Upgrade Scheme (BUS) means households are eligible for a grant even with cavity wall insulation recommendations on their EPC. Whilst this will help more households to access funding for heat pump installations, it needs to be made consistently clear that it will be the most well insulated homes that will see the most efficient savings and payback on their heat pump investment.
“Furthermore, if the move towards heat pumps is going to be successful, the current lack of skilled engineers for heat pump installations must be addressed urgently. To meet the growing demand, government initiatives and manufacturer courses to train engineers need to be launched quickly.”
“We’d like to see further expansion of the Boiler Upgrade Scheme to incorporate grants for hybrid heat pumps for England and Wales, following the successful implementation of hybrid heat pumps across Scotland — 2.1% of households in the country currently have a heat-pump heating system.
“At BOXT, we are committed to helping homeowners find the best possible solution to their home energy needs at the best possible price, whether that is a new, energy efficient boiler, a hybrid heat pump, or solar panels with battery storage.”
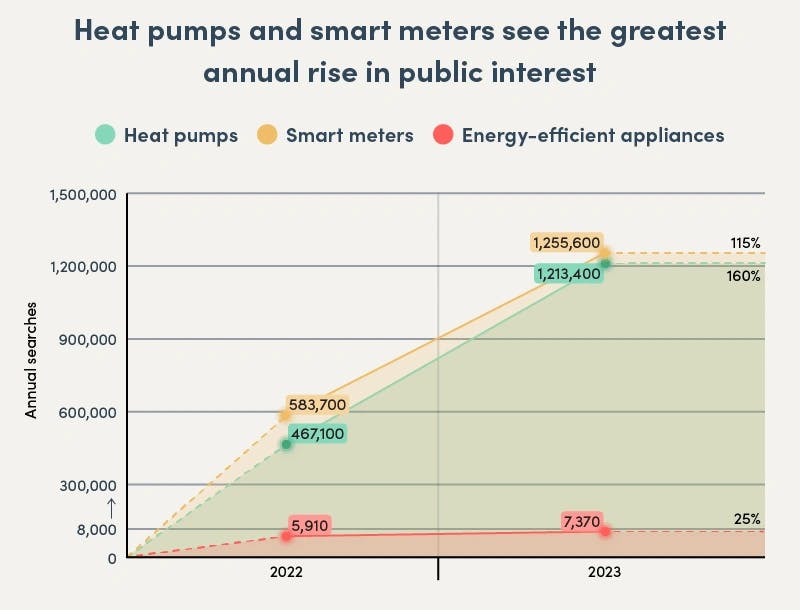
Heat pumps and smart meters see the greatest annual rise in public interest
| Rank | Energy Efficiency Trend | 2022 Total | 2023 Total | Annual Change |
| 1 | Heat pumps | 467,100 | 1,213,100 | 160% |
| 2 | Smart meters | 583,700 | 1,255,600 | 115% |
| 3 | Energy-efficient appliances | 5,910 | 7,370 | 25% |
| 4 | Hybrid heat pumps | 9,670 | 11,350 | 17% |
| 5 | Thermal wallpaper | 31,860 | 35,980 | 13% |
| 6 | Energy storage | 15,300 | 16,860 | 10% |
| 7 | Replace boiler | 82,300 | 86,300 | 5% |
| 7 | Home EV charger | 94,800 | 99,300 | 5% |
1 - Heat pumps
Annual Search Increase: 160%
Heat pumps are the biggest energy efficiency trend, with the most significant increase in search volume in 2023, with searches rising by 160% compared to the previous year. This increase in searches goes hand in hand with the rollout of the UK government’s Boiler Upgrade Scheme, suggesting that it successfully reached a broad audience and sparked public interest.
2 - Smart meters
Annual Search Increase: 115%
Smart meters saw the second-largest annual search increase, with 115% more searches in 2023 than in 2022. The UK government and energy companies have promoted smart meters for several years, and they continue to grow in popularity as the public becomes ever more familiar with the technology and is looking to stay more in control of energy usage amidst the cost of living crisis.
3 - Energy-efficient appliances
Annual Search Increase: 25%
Searches for energy-efficient appliances saw the third largest increase, rising by a quarter from 5,910 in 2022 to 7,370 in 2023. This uptick in public interest correlates with the cost of living crisis that has sent bills spiralling in many households as many people look for ways to trim unnecessary spending.
Six of the top ten locations installing air source heat pumps are in Scotland
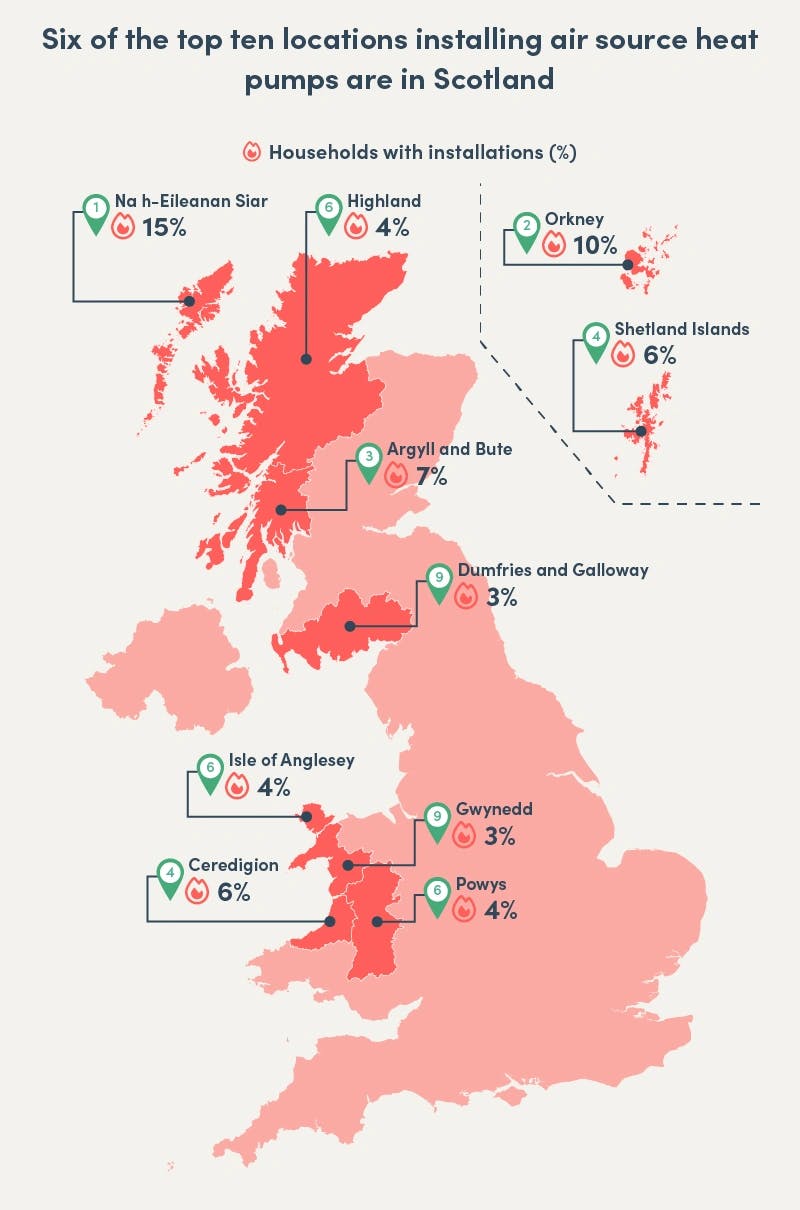
1 - Na h-Eileanan Siar
Percentage of households with installations: 15%
One in six households in the Outer Hebrides islands has had an air source heat pump installed in the last ten years. The Scottish Government has a net zero target of 2045 and aims to fulfil this (partly) by providing a £7,500 grant with the Home Energy Scotland Scheme for homeowners to install air source heat pumps. Data suggests these heat pumps are replacing oil heating systems, which are costly.
2 - Orkney Islands
Percentage of households with installations: 10%
Air source heat pumps are also seeing a significant uptake in installations in the Scottish Orkney Islands, with almost one in 10 households receiving the energy-efficient upgrade in the last ten years. Orkney is off the UK gas grid. Therefore, homes on the island mainly used oil-powered heating systems in the past. Since Scotland has a net zero target of 2045, many homes have switched to using air-source heat pumps for heating purposes.
3 - Argyll and Bute
Percentage of households with installations: 7%
Argyll and Bute is one of the Scottish local authorities leading the way with air source heat pump installations. Many domestic properties in the area have adopted heat pumps in the last ten years, as many rural homes on the inhabited islands do not receive a gas supply. Air source heat pumps are much more cost-effective than oil heating systems.
Scotland has more heat pumps per household than any other UK region
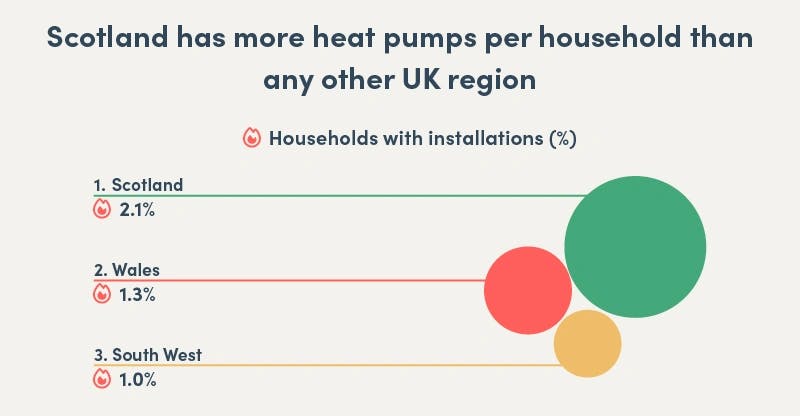
1 - Scotland
Average percentage of households with installations: 2.1%
On average, just over 2% of homes in Scottish local authorities have installed an air source heat pump over the last ten years. Scotland’s move towards renewable energy aligns with the Government's goal of achieving net zero emissions by 2045. It is also important to note that many heat pump installations nationwide are replacing oil heating systems in homes in rural areas not served by the gas grid.
2 - Wales
Average percentage of households with installations: 1.3%
Wales is close behind Scotland, with an average of 1.3% of homes across the country’s local authorities installing a heat pump in the last ten years. The country aims to generate 70% of electricity from renewable sources by 2030, and air-source heat pumps are among the most cost-effective, energy-efficient upgrades.
3 - South West
Average percentage of households with installations: 1.0%
On average, local authorities in England’s South West have one of the highest air source heat pump installation rates across all UK regions. The local authorities of South Hams, Cornwall, and Forest of Dean lead the way, with over 2% of homes installing a heat pump in the last decade. Many local authorities in the region are rural, coastal locations where access to mains gas may be limited or unavailable, which likely accounts for a proportion of heat pump installations.
Four of the top 10 locations installing solar PV are in Scotland
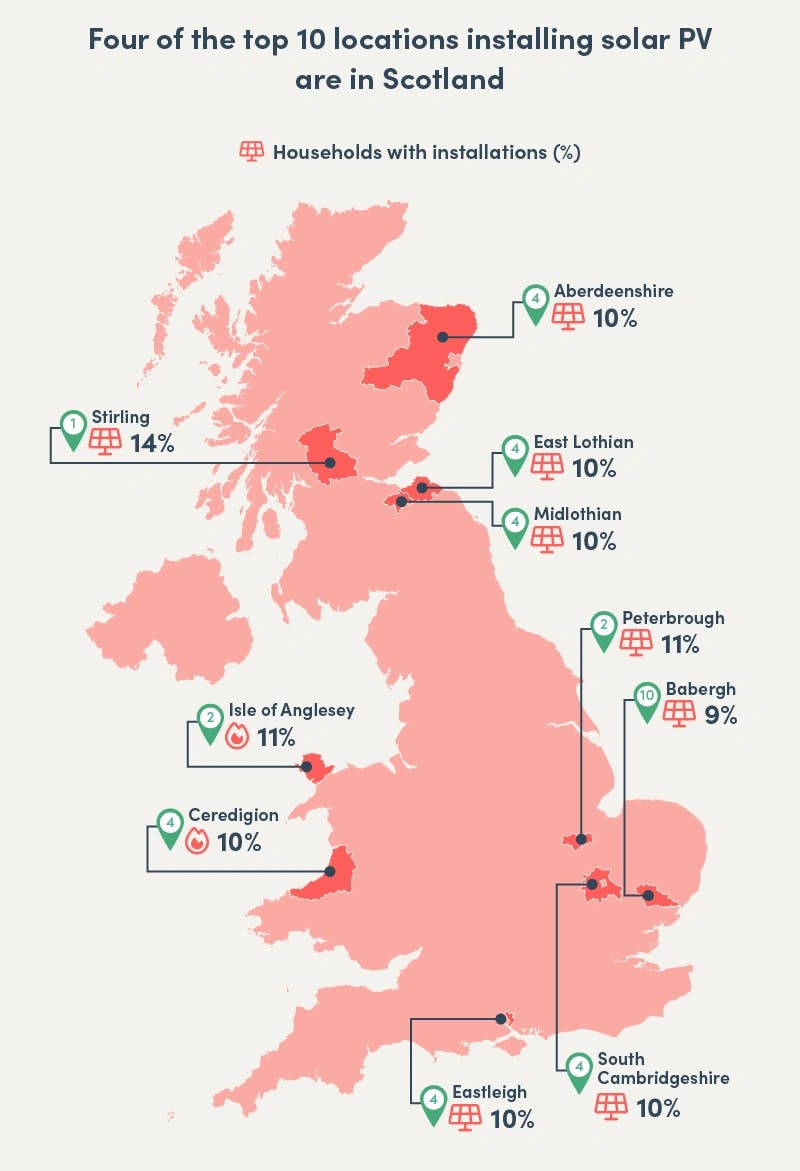
1 - Stirling - Percentage of households with installations: 14%
Almost one in six homes in Stirling have installed photovoltaic solar panels in the last ten years. While Stirling is far from the sunnier southern coast locations that might be expected to lead the way with solar installations, the area benefits from Government initiatives promoting the adoption of renewable energy and excellent grid connections. Schemes include the Feed-In Tariffs scheme, which allows homeowners to sell surplus electricity back to the grid.
2 - Isle of Anglesey
Percentage of households with installations: 11%
The Isle of Anglesey is one of the top local authorities for solar installations, with over one in 10 homes installing photovoltaic solar panels in the last decade. At the forefront of energy efficiency, the local authority is also one of the top 10 areas for air source heat pump installations. The island has many rural and farming households who benefit from generating their own electricity.
3 - Peterborough
Percentage of households with installations: 11%
Just over one in 10 households in Peterborough have introduced photovoltaic solar panels in the last decade. Peterborough gets among the most sunlight hours out of all areas of the UK. Therefore, residents in the local authority can benefit significantly from using solar panels to generate electricity.
Scotland has more solar PV installations per household than any other UK region
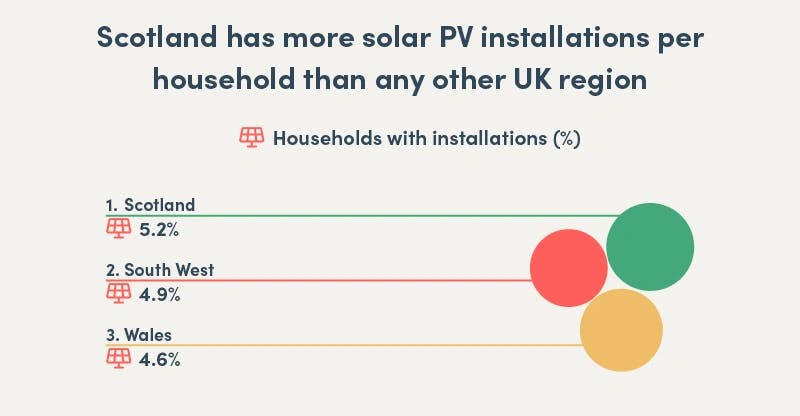
1 - Scotland
Average percentage of households with installations: 5.2%
On average, just over 5% of homes in Scottish local authorities have installed photovoltaic solar panels over the last ten years. This is likely primarily due to Scotland’s focus on renewable energy to achieve net zero emissions by 2045. Government grants for homeowners to install energy-efficient upgrades have also bolstered incentives.
2 - South West
Average percentage of households with installations: 4.9%
The South West follows closely behind Scotland, with an average of 4.9% of homes across all local authorities installing PV solar panels in the last ten years. The area benefits from a sunny climate and has excellent solar energy-producing potential.
3 - Wales
Average percentage of households with installations: 4.6%
Local authorities in Wales are among the top areas for installing solar panels, with an average of 4.6% of homes upgrading to renewable energy in the last decade. With excellent solar potential and many rural and farming households benefiting from producing their own power, it is unsurprising that Wales is at the forefront of solar installations.
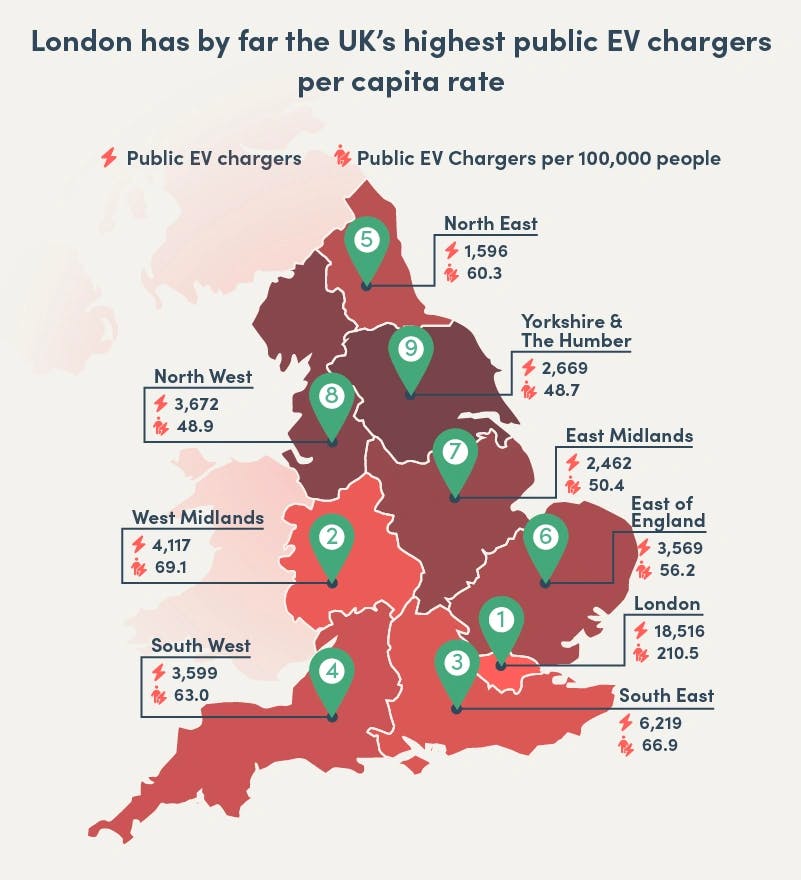
London has by far the UK’s highest public EV chargers per capita rate
| Rank | Region | Public EV Chargers | Public EV Chargers per 100,000 people |
| 1 | Scotland | 4,592 | 83.8 |
| 2 | England | 46,374 | 82.0 |
| 3 | Wales | 2,246 | 72.3 |
| 4 | Northern Ireland | 465 | 24.4 |
| 1 | London | 18,516 | 210.5 |
| 2 | West Midlands | 4,117 | 69.1 |
| 3 | South East | 6,219 | 66.9 |
| 4 | South West | 3,599 | 63.0 |
| 5 | North East | 1,596 | 60.3 |
| 6 | East of England | 3,569 | 56.2 |
| 7 | East Midlands | 2,462 | 50.4 |
| 8 | North West | 3,627 | 48.9 |
| 9 | Yorkshire and the Humber | 2,669 | 48.7 |
| - | United Kingdom | 53,677 | 80.1 |
London is the region of England with the highest number of public EV chargers per 100,000 people, with 210.5. This far outstrips any other English region, as the West Midlands has the second-highest rate with 69.1 chargers per 100,000 people, while the area with the lowest rate is Yorkshire and the Humber, where the figure sits at just 48.7. London also has more electric and plug-in hybrid vehicles than any other UK region. On average, almost one in six (14%) licensed vehicles across all London boroughs are electric vehicles or plug-in hybrids. Westminster has more electric cars and plug-in hybrids than any other borough, at over a third (34%).
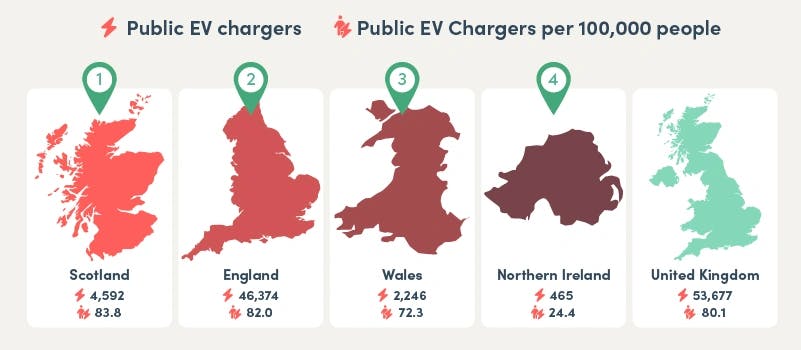
When comparing UK countries, Scotland has the highest rate of public EV chargers, with 4,952 chargers, translating to 83.8 per 100,000 people. England has the second highest rate, with 82 public chargers per 100,000 people, while Wales takes third place with 72.3. The number of EV chargers meets demand, with Scottish local authorities having, on average, 6% of all licensed vehicles classified as electric vehicles and plug-in hybrids; this is higher than the 4% average in Wales.
However, like Scotland, Wales has a higher rate of public EV chargers per capita than any English region outside of London, showing a clear division between the capital region and the rest of England. Interestingly, Northern Ireland has the lowest rate of public EV chargers, with 24.4 per 100,000 people, approximately half that of the lowest-scoring English region.
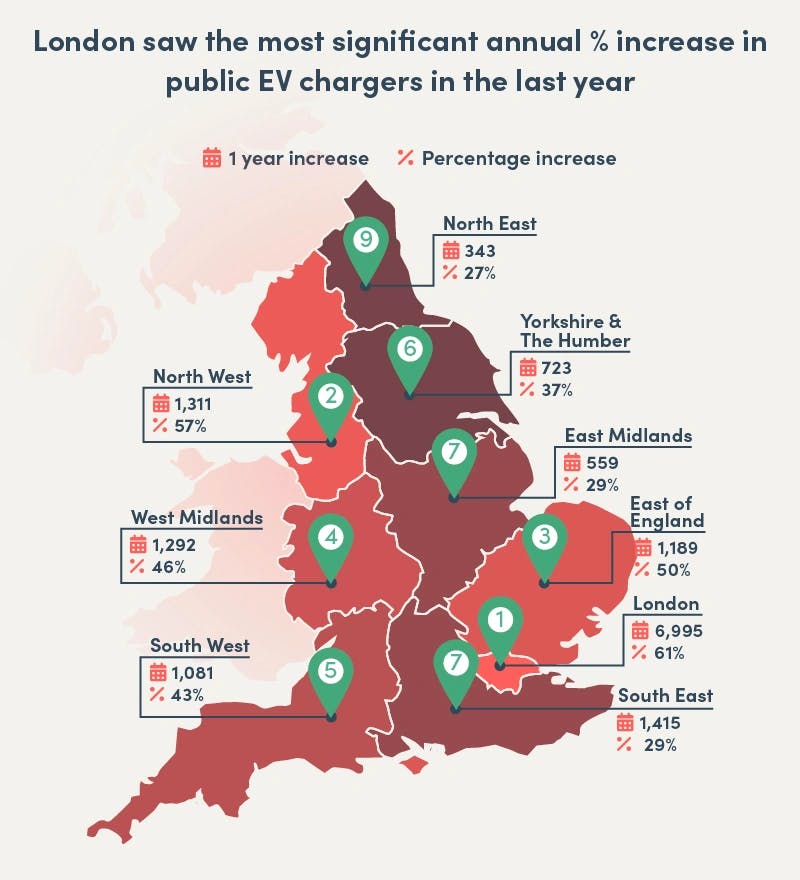
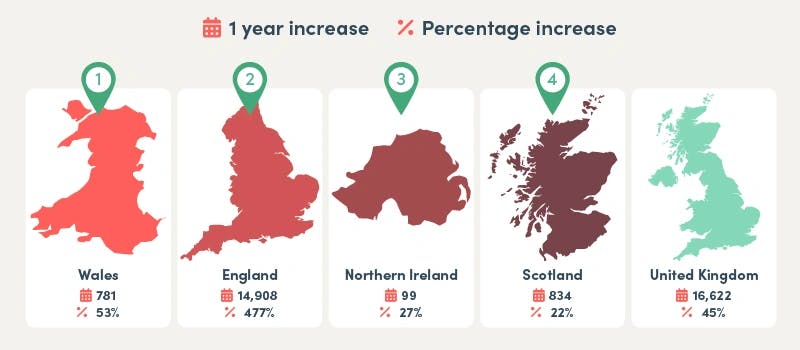
London saw the most significant annual % increase in public EV chargers in the last year
| Rank | Region | January 2023 | January 2024 | 1 Year Increase | % Increase |
| 1 | Wales | 1,465 | 2,246 | 781 | 53% |
| 2 | England | 31,466 | 46,374 | 14,908 | 47% |
| 3 | Northern Ireland | 366 | 465 | 99 | 27% |
| 4 | Scotland | 3,758 | 4,592 | 834 | 22% |
| 1 | London | 11,521 | 18,516 | 6,995 | 61% |
| 2 | North West | 2,316 | 3,627 | 1,311 | 57% |
| 3 | East of England | 2,380 | 3,569 | 1,189 | 50% |
| 4 | West Midlands | 2,825 | 4,117 | 1,292 | 46% |
| 5 | South West | 2,518 | 3,599 | 1,081 | 43% |
| 6 | Yorkshire and the Humber | 1,946 | 2,669 | 723 | 37% |
| 7 | South East | 4,804 | 6,219 | 1,415 | 29% |
| 7 | East Midlands | 1,903 | 2,462 | 559 | 29% |
| 9 | North East | 1,253 | 1,596 | 343 | 27% |
| - | United Kingdom | 37,055 | 53,677 | 16,622 | 45% |
Despite already having the most public EV chargers in January 2023, including both English regions and UK countries, London saw the most significant percentage increase to January 2024. Over the last year, 14,908 public EV chargers were added in the capital region, bringing London’s total number to 18,616, an increase of 61% from 11,521 in January 2023.
In the past year, Westminster is the London borough where EV usage has grown the most. There was a 61% increase in the proportion of all licensed vehicles classified as electric or plug-in hybrids in the last year. This increase in EV usage matches the availability of chargers, as Westminster is also the local authority with the highest number of public EV chargers per 100,000 people, at 1,328.
Outside of London, the English region with the most significant rise in public EV chargers was the North West, adding 1,311 chargers for an increase of 57%. In contrast, the North East was the English region with the lowest growth of 27.37% from 343 new public EV chargers being added. Barrow-in-Furness experienced the most significant change, with a 64% increase in the proportion of all licensed vehicles classified as electric or plug-in hybrids in the past year.
The UK country with the highest increase in public EV chargers is Wales, with 781 new chargers and a rise of 53%. This is higher than the overall increase for England, which sits at 47% and is the third highest rate compared to English regions. Meanwhile, Scotland saw the lowest growth of any country, with 834 new EV chargers translating to a rise of 22%.
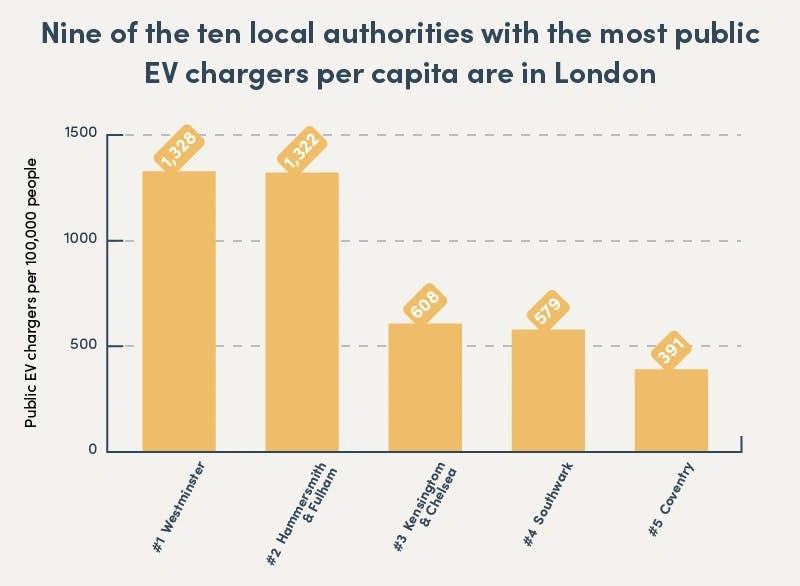
Nine of the ten local authorities with the most public EV chargers per capita are in London
| Rank | Local Authority | Public EV Chargers | Public EV Chargers per 100,000 people |
| 1 | Westminster | 2,724 | 1,328 |
| 2 | Hammersmith and Fulham | 2,424 | 1,322 |
| 3 | Kensington and Chelsea | 875 | 608 |
| 4 | Southwark | 1,774 | 579 |
| 5 | Coventry | 1,343 | 391 |
| 6 | Richmond upon Thames | 755 | 387 |
| 7 | Merton | 791 | 367 |
| 8 | Wandsworth | 1,129 | 344 |
| 9 | Brent | 1,048 | 309 |
| 10 | Camden | 590 | 280 |
| 11 | Islington | 568 | 262 |
| 12 | Orkney Islands | 52 | 231 |
| 13 | Watford | 226 | 221 |
| 14 | East Lothian | 240 | 219 |
| 15 | Kingston upon Thames | 353 | 210 |
| 16 | Na h-Eileanan Siar | 48 | 180 |
| 16 | Stirling | 168 | 180 |
| 18 | Milton Keynes | 508 | 176 |
| 19 | Ceredigion | 124 | 175 |
| 19 | Waltham Forest | 487 | 175 |
1 - Westminster
Public EV Chargers per 100,000 people: 1,328
Westminster is the local authority with the highest level of public EV chargers, with 1,328 per 100,000 people. This central London area has 2,724 public EV chargers, serving the local population and many daily commuters, tourists, and other visitors.
2 - Hammersmith and Fulham
Public EV Chargers per 100,000 people: 1,322
Hammersmith and Fulham has the next highest rate of public EV chargers, with 1,322 per 100,000 people. While the area just misses taking the top spot, its rate is more than twice that of the next highest local authority.
3 - Kensington and Chelsea
Public EV Chargers per 100,000 people: 608
Kensington and Chelsea takes third place, with a rate of 608 public EV chargers per 100,000 people. This means that all the top three local authorities are in central London, while nine of the top 10 local authorities are in Greater London. The only exception is Coventry, which took fifth place with a rate of 391 public EV chargers per 100,000 people.
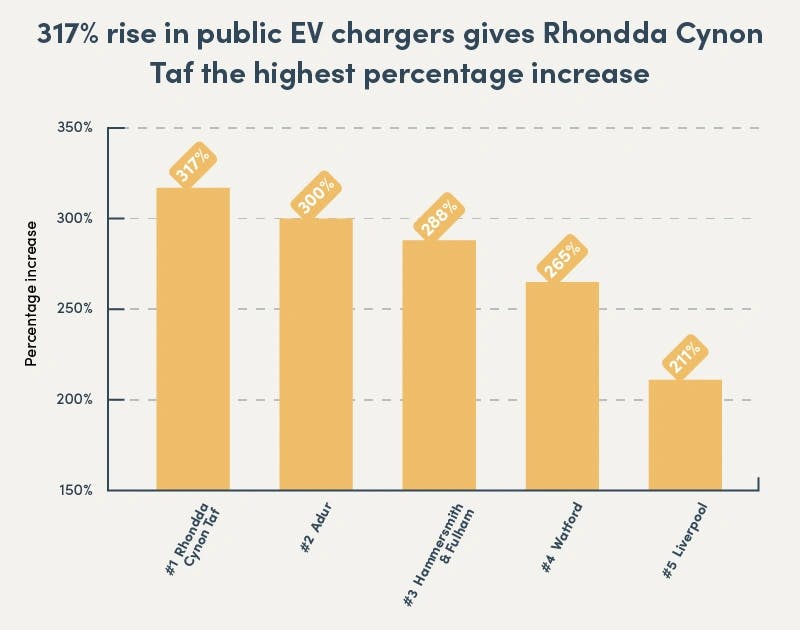
317% rise in public EV chargers gives Rhondda Cynon Taf the highest percentage increase
| Rank | Local Authority | January 2023 | January 2024 | 1 Year Increase | % Increase |
| 1 | Rhondda Cynon Taf | 35 | 146 | 111 | 317% |
| 2 | Adur | 13 | 52 | 39 | 300% |
| 3 | Hammersmith and Fulham | 624 | 2,424 | 1,800 | 288% |
| 4 | Watford | 62 | 226 | 163 | 265% |
| 5 | Liverpool | 194 | 604 | 410 | 211% |
| 6 | Merton | 259 | 791 | 532 | 205% |
| 7 | Mole Valley | 35 | 105 | 70 | 200% |
| 8 | Stevenage | 21 | 59 | 38 | 181% |
| 9 | Brentwood | 7 | 19 | 12 | 171% |
| 10 | Worthing | 24 | 64 | 40 | 167% |
1 - Rhondda Cynon Taf
Annual % Increase: 317%
The local authority area with the highest rise in public EV chargers is Rhondda Cynon Taf, where chargers rose by 317% from just 35 in 2023 to 146 in 2024. This area of Wales, just north of the capital, Cardiff, is mainly rural, consisting of five valleys and several large towns, meaning these chargers could provide quite a wide-ranging geographical coverage.
2 - Adur
Annual % Increase: 300%
The Adur local authority saw the second highest percent increase in public EV chargers, with a 300% increase. However, this area's total number of chargers remains very low, with 52, while the percent increase represents an additional 39 chargers, raising the number from just 13 in January 2023. This highlights the disparity in public EV charging stations between local areas.
3 - Hammersmith and Fulham
Annual % Increase: 288%
Hammersmith and Fulham saw the third-highest annual increase in public EV chargers at 288%. This huge relative increase comes despite the already high number of chargers in January 2023, with an additional 1,800 chargers bringing the local authority’s total up to 2,424.
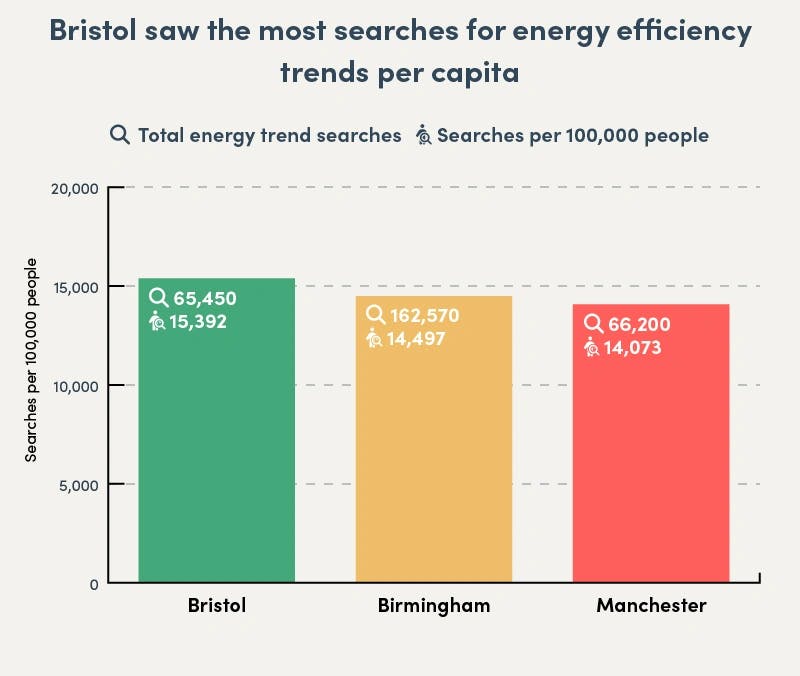
Bristol saw the most searches for energy efficiency trends per capita
| Rank | City | Population | Total Energy Trend Searches | Searches per 100,000 people |
| 1 | Bristol | 425,232 | 65,450 | 15,392 |
| 2 | Birmingham | 1,121,408 | 162,570 | 14,497 |
| 3 | Manchester | 470,411 | 66,200 | 14,073 |
| 4 | Liverpool | 506,552 | 67,900 | 13,404 |
| 5 | Leeds | 536,321 | 70,780 | 13,197 |
| 6 | Edinburgh | 505,310 | 54,880 | 10,861 |
| 7 | Sheffield | 500,552 | 52,910 | 10,570 |
| 8 | Coventry | 344,322 | 35,750 | 10,383 |
| 9 | Newcastle upon Tyne | 386,468 | 28,030 | 9,785 |
| 10 | London | 8,776,535 | 838,810 | 9,557 |
| 11 | Plymouth | 266,983 | 24,190 | 9,061 |
| 12 | Glasgow | 631,690 | 56,580 | 8,957 |
| 13 | Brighton and Hove | 277,106 | 22,330 | 8,058 |
| 14 | Bradford | 333,931 | 26,850 | 8,041 |
| 15 | Leicester | 406,588 | 31,350 | 7,711 |
| 16 | Nottingham | 299,797 | 17,780 | 5,931 |
| 17 | Belfast | 340,000 | 19,360 | 5,694 |
| 18 | Kingston upon Hull | 270,806 | 14,590 | 5,388 |
| 19 | Cardiff | 348,546 | 14,670 | 4,209 |
| 20 | Derby | 275,599 | 11,170 | 4,053 |
1 - Bristol
Searches per 100,000 people: 15,392
The UK city with the most significant interest in energy efficiency trends is Bristol, where there were 15,392 searches for all the trends in our study per 100,000 people. Heat pumps were the most-searched trend in Bristol, with 10,990 searches, followed by smart meters, solar panels and LED lighting.
2 - Birmingham
Searches per 100,000 people: 14,497
Birmingham had the second-highest number of searches for energy efficiency trends in our study, with 14,497 searches per 100,000 people. The people of Birmingham were most interested in smart meters, searching for them 28,020 times in 2023, with LED lighting and heat pumps receiving more than 20,000 searches each.
3 - Manchester
Searches per 100,000 people: 14,073
Manchester saw the third-highest number of searches per capita for energy efficiency trends, with 14,073 per 100,000 people. Heat pumps were the most popular trend in Manchester, with 11,250 searches in 2023, followed by smart meters and LED lighting in second and third place, respectively.
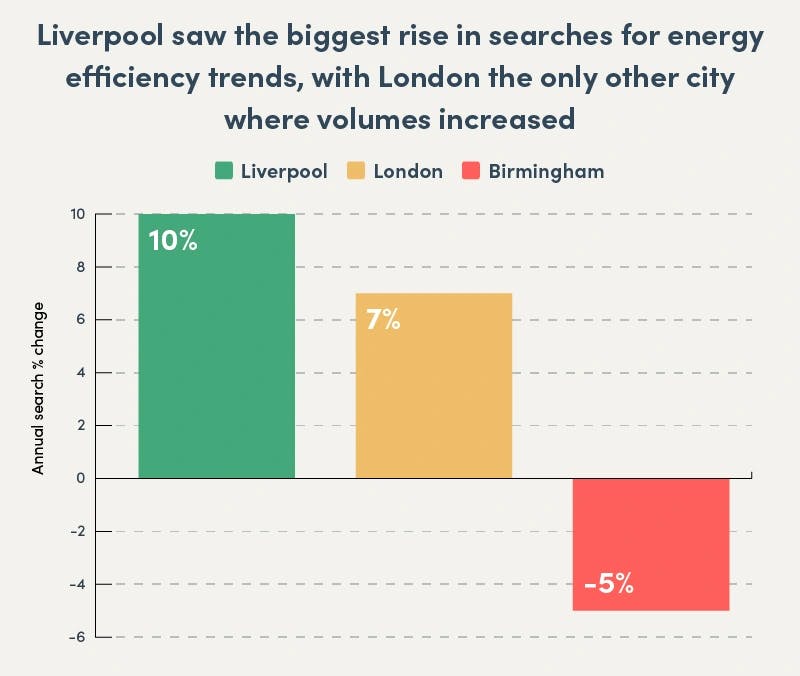
Liverpool saw the biggest rise in searches for energy efficiency trends, with London the only other city where volumes increased
| Rank | Energy Efficiency Trend | Total 2022 | Total 2023 | Annual % Change |
| 1 | Liverpool | 61,460 | 67,900 | 10% |
| 2 | London | 786,750 | 838,810 | 7% |
| 3 | Birmingham | 170,750 | 162,570 | -5% |
| 4 | Edinburgh | 58,260 | 54,880 | -6% |
| 5 | Coventry | 38,580 | 35,750 | -7% |
| 6 | Sheffield | 58,090 | 52,910 | -9% |
| 7 | Manchester | 73,950 | 66,200 | -10% |
| 8 | Plymouth | 28,700 | 21,190 | -16% |
| 8 | Bristol | 78,300 | 65,450 | -16% |
| 10 | Leeds | 88,880 | 70,780 | -20% |
| 11 | Brighton and Hove | 28,570 | 22,330 | -22% |
| 12 | Newcastle upon Tyne | 36,600 | 28,030 | -23% |
| 13 | Glasgow | 77,480 | 56,580 | -27% |
| 14 | Belfast | 28,740 | 19,360 | -33% |
| 14 | Bradford | 40,070 | 26,850 | -33% |
| 16 | Kingston upon Hull | 23,510 | 14,590 | -38% |
| 16 | Leicester | 50,700 | 31,350 | -38% |
| 18 | Cardiff | 31,904 | 14,670 | -54% |
| 19 | Nottingham | 42,040 | 17,780 | -58% |
| 20 | Derby | 32,100 | 11,170 | -65% |
1 - Liverpool
Annual Search Change: 10%
Liverpool had the most significant increase in searches for energy efficiency trends in 2023, with a rise of 10% from the previous year, seeing search volumes reach an annual total of 67,900. The most searched-for trend in Liverpool was smart meters, with 13,100 searches.
2 - London
Annual Search Change: 7%
London saw the second-largest increase in annual searches for energy efficiency trends in 2023, with a rise of 7%. Heat pumps were the most popular trend in London in 2023, followed by LED lighting, smart meters and solar panels, all of which received more than 100,000 searches.
3 - Birmingham
Annual Search Change: -5%
Birmingham takes third place, in this instance, with the lowest decrease in search volumes of 5% from the previous year. Only two cities saw an increase in search volumes for these trends in 2023, with all other cities in our study experiencing a drop in interest.
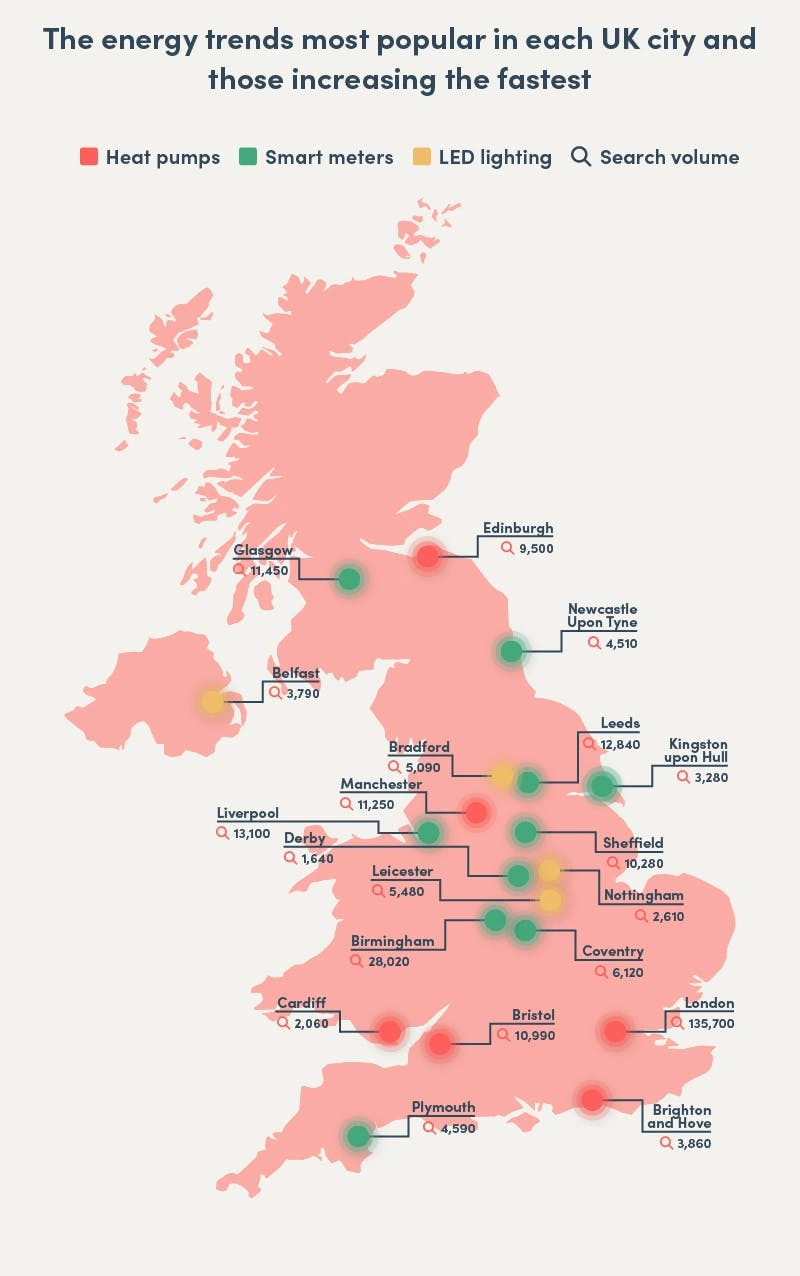
The energy trends most popular in each UK city and those increasing the fastest
| City | Most Popular Energy Trend | Search Volume | Trend with Biggest Increase | % Increase |
| London | Heat pumps | 135,700 | Heat pumps | 103% |
| Birmingham | Smart meters | 28,020 | Heat pumps | 171% |
| Glasgow | Smart meters | 11,450 | Heat pumps | 58% |
| Leeds | Smart meters | 12,840 | Heat pumps | 110% |
| Liverpool | Smart meters | 13,100 | Heat pumps | 214% |
| Edinburgh | Heat pumps | 9,500 | Heat pumps | 98% |
| Sheffield | Smart meters | 10,280 | Heat pumps | 144% |
| Manchester | Heat pumps | 11,250 | Heat pumps | 99% |
| Bristol | Heat pumps | 10,990 | Heat pumps | 89% |
| Leicester | LED lighting | 5,480 | Heat pumps | 36% |
| Cardiff | Heat pumps | 2,060 | Replace boiler | 0% |
| Coventry | Smart meters | 6,120 | Heat pumps | 111% |
| Belfast | LED lighting | 3,790 |
Energy-efficient appliances Thermal wallpaper | 33% |
| Bradford | LED lighting | 5,090 | Heat pumps | 59% |
| Nottingham | LED lighting | 2,610 | Double glazing | 53% |
| Newcastle upon Tyne | Smart meters | 4,510 | Heat pumps | 84% |
| Brighton and Hove | Heat pumps | 3,860 | Heat pumps | 66% |
| Derby | Smart meters | 1,640 | Triple glazing | -17% |
| Kingston upon Hull | Smart meters | 3,280 | Heat pumps | 96% |
| Plymouth | Smart meters | 4,590 | Smart meters | 105% |
Here, you can see the most-searched energy efficiency trend in each of the 20 largest UK towns and cities and those trends that saw the most significant increase in search volumes.
Smart meters came top in the most cities, accounting for half of all those in our study, with heat pumps being the most searched in six cities, while LED lighting was the most searched in the remaining four locations.
Heat pumps were the trend with the most significant search rise in most UK cities. Derby stands out as an anomaly in that none of the energy-saving trends we looked at saw an increase from 2022 to 2023, with triple glazing seeing the lowest decrease of 17.67%.
Smart meters are the most popular energy trend in the UK
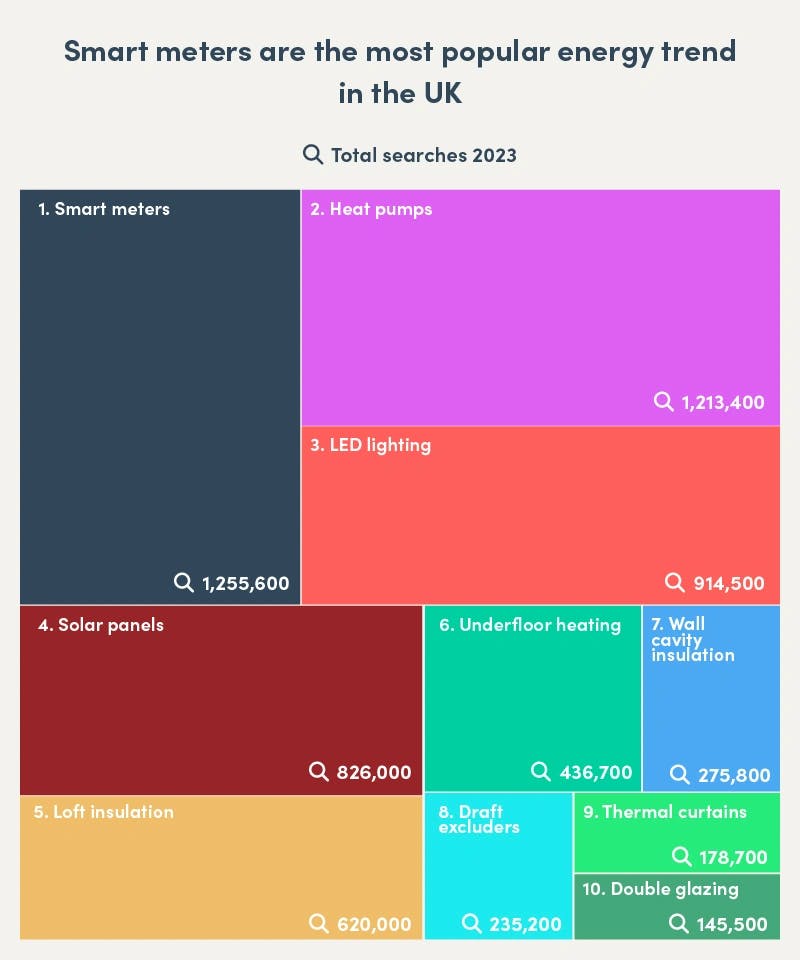
1 - Smart meters
Total Searches 2023: 1,255,600
The energy trend with the most public interest in the UK is smart meters, which received more than 1.25 million searches in 2023. Smart meters are a fantastic way of tracking how much energy you use in your home and how much it costs. By monitoring energy use in real-time, you can note when the most power is being used and isolate the appliances and habits costing you the most money.
2 - Heat pumps
Total Searches 2023: 1,213,400
Heat pumps received the second-highest searches in the UK in 2023, with more than 1.21 million. This rising popularity could be down to increased government grants, which have sat at £7,500 towards an air source heat pump and £7,500 towards a ground source heat pump since October 2023.
3 - LED lighting
Total Searches 2023: 914,500
The energy efficiency trend with the third highest number of UK searches in 2023 was LED lighting, receiving 914,500 searches. LED lights have been around for a while but remain the best option for most household lighting fixtures. LED light bulbs are typically much brighter than traditional incandescent bulbs and are much more energy-efficient, lasting many years before needing replacement.
The government energy scheme that received the most public interest is the Cold Weather Payment
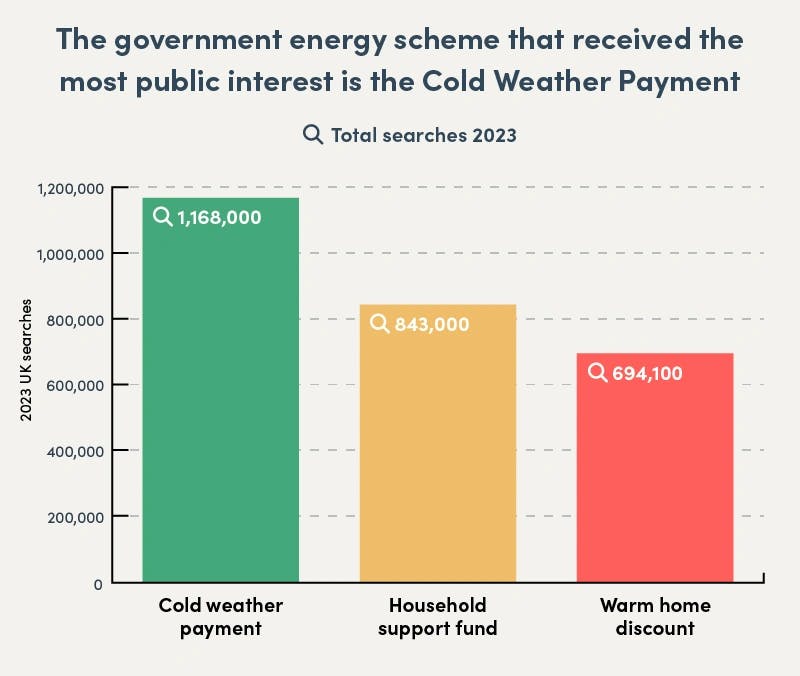
| Rank | Government Scheme | 2023 UK Searches |
| 1 | Cold Weather Payment | 1,168,000 |
| 2 | Household Support Fund | 843,000 |
| 3 | Warm Home Discount | 694,100 |
| 4 | Winter Fuel Payment | 663,900 |
| 5 | Boiler Upgrade Scheme | 76,800 |
| 6 | Great British Insulation Scheme | 72,420 |
| 7 | Feed-in Tariff | 33,500 |
| 8 | Smart Export Guarantee | 22,000 |
| 9 | Nest Wales | 21,900 |
| 10 | Home Upgrade Grant | 13,280 |
| 11 | Green Deal | 12,200 |
| 12 | Energy Company Obligation | 10,530 |
| 13 | Social Housing Decarbonisation Fund | 9,320 |
| 14 | Winter Fuel Support Scheme | 8,820 |
| 15 | Clean Heat Market Mechanism | 6,800 |
| 16 | Home Energy Efficiency Programme Scotland (HEEPS) | 2,220 |
| 17 | Sustainable Warmth Competition | 690 |
1 - Cold Weather Payment
2023 UK Searches: 1,168,000
The Cold Weather Payment is the most popular government scheme in the UK, with almost 1.17 million searches in 2023. If the average temperature in your area is zero degrees Celsius or below over seven consecutive days, then you could receive payments of £25 if you receive certain benefits. This payment is intended to protect vulnerable groups from prolonged extreme cold, allowing them to use their heating and keep warm. Cold Weather Payments are unavailable in Scotland, though the similar Winter Heating Payment scheme is available.
2 - Household Support Fund
2023 UK Searches: 843,000
The Household Support Fund is the government scheme with the second-highest number of searches, with 843,000 in 2023. The fund was introduced in 2021 to help vulnerable households during the COVID-19 pandemic but has since been extended to March 2024. There have been calls for a further extension to this support package, though at the time of writing, such an extension has yet to be confirmed nor denied.
3 - Warm Home Discount
2023 UK Searches: 694,100
The Warm Home Discount took third place with 694,100 searches in 2023. This government scheme was introduced for the 2023/2024 winter period, offering eligible households a £150 discount on energy bills. Those receiving pension credit or on low incomes with high energy costs could be eligible in England and Wales, while the criteria differ in Scotland.
4 - Winter Fuel Payment
2023 UK Searches: 663,900
In fourth place is the Winter Fuel Payment, which received 663,900 searches in 2023. This scheme is available to people born before 25 September 1957 and provides those eligible with a one-off payment of between £250 and £600 to help with winter fuel bills.
5 - Boiler Upgrade Scheme
2023 UK Searches: 76,800
The Boiler Upgrade Scheme is the fifth most popular, with 76,800 UK searches in 2023. This differs from the other high-scoring schemes as it does not offer financial relief or discounts but provides grants to property owners to install low-carbon heating systems such as heat pumps. This newer technology is better for the environment as it does not burn fossil fuels and can be cheaper to run than traditional boilers.
The Great British Insulation Scheme was the most searched government energy scheme of 2023
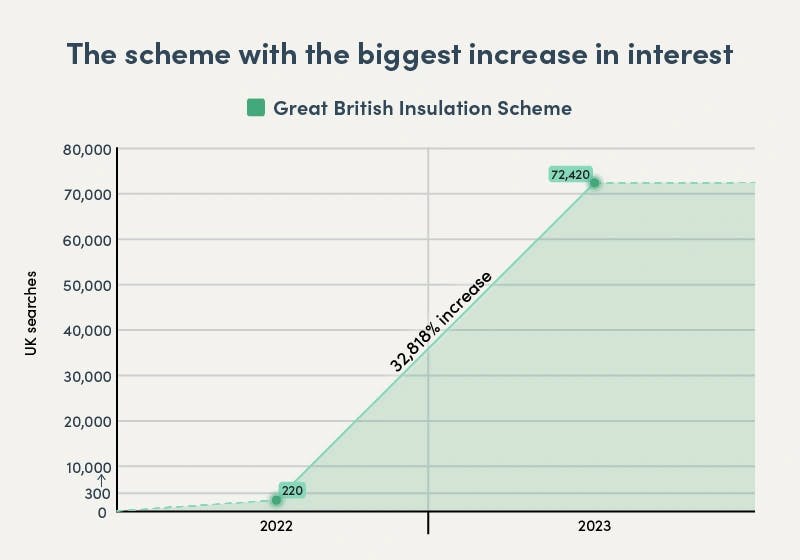
| Rank | Government Scheme | UK Searches 2022 | UK Searches 2023 | UK % Increase |
| 1 | Great British Insulation Scheme | 220 | 72,420 | 32,818% |
| 2 | Home Upgrade Grant | 7,620 | 13,280 | 74% |
| 3 | Boiler Upgrade Scheme | 56,300 | 76,800 | 36% |
| 4 | Home Energy Efficiency Programme Scotland (HEEPS) | 1,960 | 2,220 | 13% |
| 5 | Social Housing Decarbonisation Fund | 9,130 | 9,320 | 2% |
1 - Great British Insulation Scheme
% Search Increase: 32,818%
2023 Additional Searches: 72,200
Here, we can see that the Great British Insulation Scheme received the most significant increase in searches in 2023, with a rise of more than 32,000%. This increase in searches, with 72,200 more than in 2022, can be attributed to the scheme only launching in March 2023.
The Great British Insulation Scheme offers homeowners and renters the opportunity to receive free or discounted home insulation, which would help retain heat and bring energy bills down, especially in the winter months. A wide range of insulation types are available in this scheme, including wall cavity insulation, loft insulation, underfloor insulation and more.
2 - Home Upgrade Grant
% Search Increase: 74%
2023 Additional Searches: 5,660
The Home Upgrade Grant saw the second-highest increase in searches, 74%, with an additional 5,660 searches in 2023. This grant is only available to homeowners in England who do not use a gas boiler. It aims to make their homes more energy-efficient, better insulated and more environmentally friendly. Successful applicants can consult with their local council to receive fully-funded home improvements such as wall, loft and underfloor insulation, air source heat pumps or electric radiators.
3 - Boiler Upgrade Scheme
% Search Increase: 36%
2023 Additional Searches: 20,500
The Boiler Upgrade Scheme saw the third-largest increase of 36%, with an additional 20,500 searches in 2023. While the scheme was already popular in 2022, with 56,300 searches, the jump to 76,800 searches in 2023 shows that it has caught the public’s interest and continues to offer value to the British public who are concerned with both their bills and lessening their impact on the environment.
The Clean Heat Market Mechanism also saw impressive searches in 2023
Another new government energy scheme, the Clean Heat Market Mechanism (CHMM), also saw considerable searches, with 6,800 in 2023. As there were no searches for the scheme in 2022, we could not calculate a percent increase in search volumes, so were unable to include it in the above table.
The Clean Heat Market Mechanism is a scheme designed to ensure manufacturers of heating appliances increase the proportion of low-carbon heat pumps they sell compared to fossil fuel boilers. Under this mechanism, manufacturers would be fined £3,000 for every missed heat pump sale, encouraging a shift from more heavily polluting technologies to cleaner, cheaper alternatives.
However, according to recent reports, there is a risk the scheme could be scrapped in 2024. The reason for the potential scrapping of the CHMM is concern that customers could foot the bill for fines levied against producers through increased prices. At the time of writing, this decision is still up in the air, with no public decision being made either way.
The Boiler Upgrade Scheme received the most applications per capita in South West England
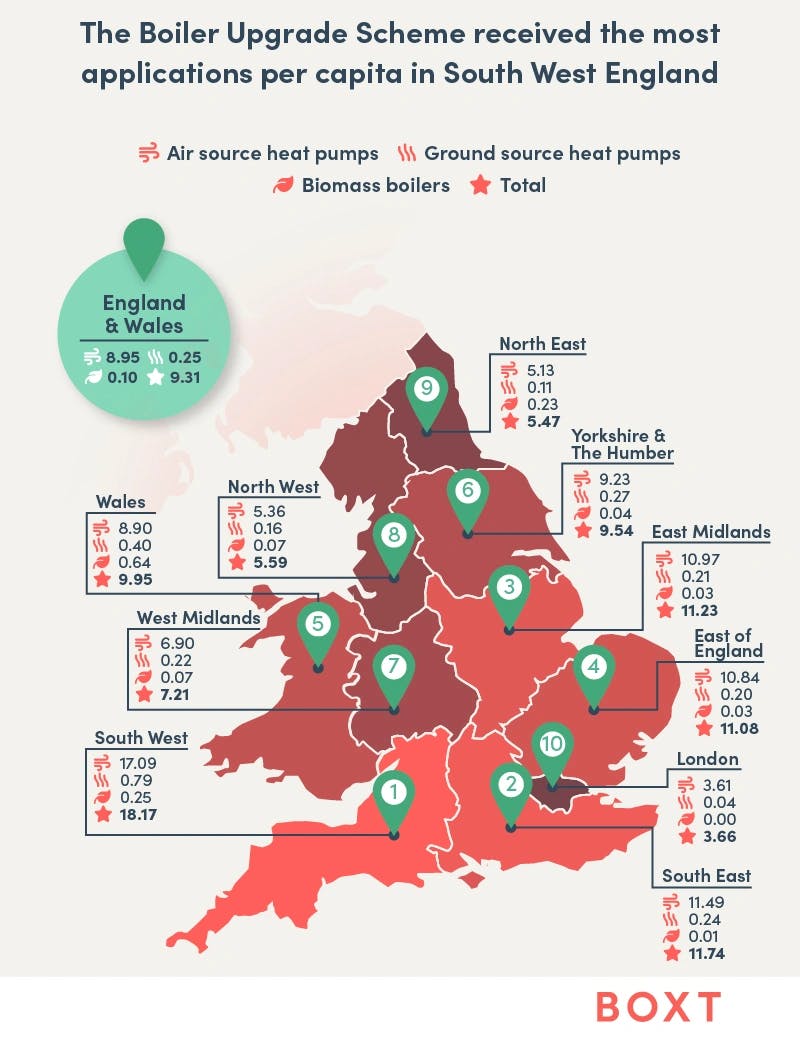
South West England saw the highest rate of domestic applications to the Boiler Upgrade Scheme in England and Wales, with 18.17 applications per 100,000 people across all boiler upgrade types. This is almost double the overall rate for England and Wales, which sits at 9.31 applications per 100,000 people. The next-highest rate was seen in the South East, where applications reached 11.74 per 100,000, highlighting the lead the South West has built up in updating their boilers to newer technologies.
South West England topped the table for ground-source and air-source heat pumps, with application rates of 0.79 and 17.09 per 100,000 people, respectively. Again, these rates were considerably higher than the next-highest, with the South East having the second-highest rate of air-source heat pump applications at 11.49 per 100,000, while Wales has the second-highest rate of ground-source heat pump applications at 0.40 per 100,000.
Domestic applications for boiler replacements were also made for biomass boilers, though these typically saw the lowest rates of the three featured technologies. However, Wales bucked the trend in this instance, receiving the highest rate of applications with 0.64 per 100,000 people. The next highest rate was seen in the South West, where it reached 0.25 applications per 100,000 people, while the North East took third place with a rate of 0.24.
London saw the lowest rate of applications to the Boiler Upgrade Scheme
The capital region of Greater London saw the lowest overall rate of applications to the Boiler Upgrade Scheme, with just 3.66 per 100,000 people. Additionally, the London region recorded the lowest number of applications for each type of boiler upgrade, with application rates of 3.61 per 100,000 for air-source heat pumps, 0.04 for ground-source heat pumps, and a rate of zero for biomass boilers.
The North East and the North West saw the next-lowest rates of applications to the Boiler Upgrade Scheme, at 5.47 and 5.59 applications per 100,000, respectively. Interestingly, though, the South East of England saw the next-lowest rate of applications for biomass boilers, with just 0.01 per 100,000 people, followed by the East of England and the East Midlands with rates of 0.03. This indicates that biomass boilers are much less popular the further South and East you travel in the United Kingdom.
Methodology
We wanted to compare various energy-related government schemes currently being rolled out in the UK. To do this, we used Google Keyword Planner to compare search volumes for 18 UK schemes and grants from Ofgem and GOV.UK.
This search data was collected for 2022 and 2023 for each country in the UK. We revealed the most popular trends in the UK and each constituent country in 2023 and revealed which trends saw the most significant increase in interest from 2022.
Applications for the Boiler Upgrade Scheme were compared to see which parts of the country were most interested in the scheme. This was done using data from GOV.UK.
Also using GOV.UK data, we compared the number of public EV chargers in different parts of the country and looked at where the number of chargers had increased the most.
We sourced the percentage of all licensed electric vehicles and plug-in hybrids in each local authority using the Department for Transport Vehicle licensing statistics data tables: Table VEH0105 looking at vehicles of all keepership and body type as of 2023 Q3. We calculated the one-year percentage change by comparing this figure to the licensed vehicles in 2022 Q3.
We also wanted to analyse the popularity of various energy efficiency trends in the UK. We used Google Keyword Planner to record search volumes for 26 energy efficiency trends in the UK and the top 20 most populated towns and cities according to census data gathered via City Population.
This search data was collected for 2022 and 2023, allowing us to reveal the most popular trends in the UK and each city per 100,000 people and the year-on-year increase in search volumes.We sourced the percentage of households with PV solar and air source heat pump installations between 2014 and 2024, as of 19/02/2024, using the MCS Data Dashboard, looking at domestic and commercial installations across local authorities. We then used each local authority’s major UK region to calculate the regions with the highest average percentage of households with PV solar and air source heat pump installations.